Is your business facing any of these issues?
Customer complaints about product quality, Customer complaints about poor service, Frustrated colleagues, Duplicated work, Work not done, Wasted resources & Production bottlenecks.
It may be time to update some of your processes. Here’s how to get started.
Once you’ve discovered in which area the breakdown occurred and identified the processes involved, you’ll have to determine which process (or processes) are causing the issue. When you decide which one you want to tackle first, begin by documenting each step in the current process.
Two useful tools are the Flowchart and the Swim Lane Diagram. These tools show the steps in the process visually.
Flow Charts
Flow charts are the more familiar of the two. They are easy-to-understand diagrams that show how the steps in a process fit together in the proper sequence. Their simplicity makes them useful tools for communicating how processes work, and for documenting how to do a particular job. They can be a good planning and analysis tool as well. Sometimes just the act of mapping out a process using a flow chart can clarify your understanding of it. And that can help you make improvement, too
Team leaders and supervisors often use Flow Charts to record the sequence of tasks in a particular process. It is often used in a training setting to help new or inexperienced team members understand the process, and complete activities in the right order.
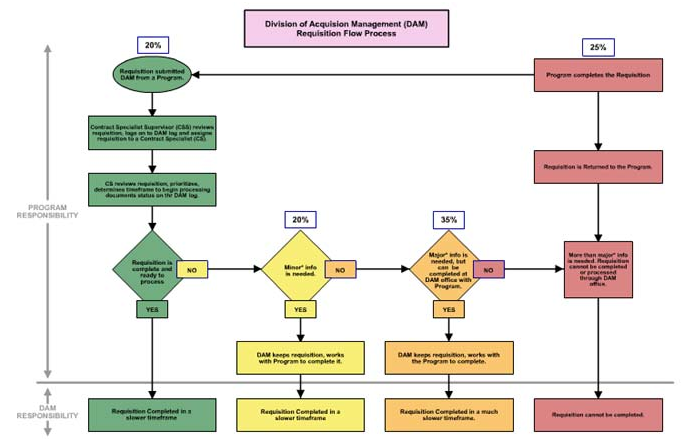
Swim Lane Diagrams
Swim lane diagrams are slightly more complex than flowcharts. They were proposed by Geary Rummler and Alan Brache in their 1990 book, Improving Processes. This diagramming method allows you to plot and trace processes, and especially the interconnections between processes, departments and teams.
The unique feature of Rummler-Brache charts is the use of horizontal rows across the diagram page. Picture a swim meet where each swimmer has his or her own “swim lane.” Using this diagramming method, each “swim lane” indicates an individual, a team, a department, or any other organizational unit. They are a great tool to help discover processing gaps and inefficiencies, with the added advantage of focusing on those high risk interconnections between departments and teams. This can help you spot more clearly any “hand-off” issues between responsible parties.
With both mapping methods it’s important to explore each phase in detail, as some processes may contain sub-steps that you’re not aware of. Consult people who use the process regularly to ensure that you don’t overlook anything important.
The Microsoft Office Suite has several applications (PowerPoint, Excel, Visio) that can help you create process charts and there are add-ons available in the marketplace that can make the job even easier.
Visual Integrators can help you eliminate inefficiencies and simplify your business by automating your office processes. Call today to find out how!
Visual Integrators
753 Sussex Ct, Sykesville, MD 21784
(410) 549-9685