
Pivot Tables
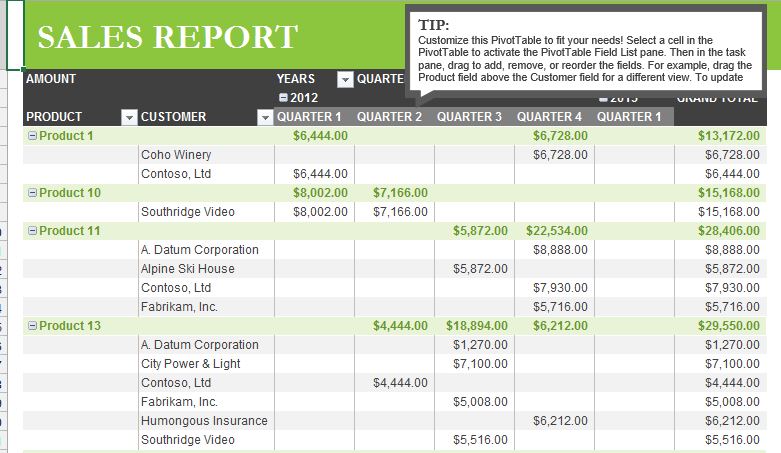
What’s the most power tool in MS Excel? That’s easy – pivot tables. No other Excel tool gives you the flexibility and analytical capability of a pivot table. They allow you to work with and compare summarized data (key term) from an Excel list or table, regardless of how it was originally arranged, i.e. you can drag and drop columns and rows into your pivot table to reconfigure how your data is related. You can even arrange additional columns as sub-data with a larger category, like breaking down appliances sold into stoves, washers, dryers and refrigerators.
When you get the rows and columns the way you want them, you can then work the numbers. Perhaps you want to know the number of each appliance sold, the percentage of total sales represented by each and the total revenue generated by each on, too. No problem, you simple “pivot” the table by changing the calculation performed of the value field of your table. And this is all done in a flash without having to manipulate your original data at all.
Speaking of original data, it can come from another worksheet in your Excel workbook (file), another workbook, multiple workbooks, or external data can even be downloaded from a company database. In other words, you can probably use data you’re already collecting, as long as it is put into a simple Excel list format. Here are some tips about that format.
- Leave no completely blank rows or columns
- Do not include subtotals
- Make sure each field (cell) contains data. Try to avoid nulls. Use NA when possible.
Tip: If the number of pieces of data you collect for analyzing is likely to vary each time ( e.g. weekly, monthly, yearly), you can create an Excel Table that will expand or shrink as data is added or removed. With this data being dynamic, you won’t have to worry about missing data. If you use an Excel Table to supply data for your pivot table, the pivot table and your data will always be in synch.
Getting Started
Building a pivot table is not complicated. It only takes a minute (or less) if you have well-organized source data. Compare that to manually compiling data into a columns and rows for analysis.
Here’s the quick, five-step process to create your first pivot table.
- Select any cell in the source data
- On the Insert tab of the ribbon, click the PivotTable button
- In the Create PivotTable dialog box, check the data and click OK
- Drag a “label” field into the Row Labels area (e.g. product)
- Drag a numeric field into the Values area (e.g. quantity)
There are many websites and how-to videos on the web to help you get started. Here’s a particularly good one: Exceljet.net
One last bit of advice before you start. Plan before you build. Take some notes on what you are trying to measure or understand, and sketch out a few simple reports on a piece of paper. These simple notes can help guide you through the large number of choices you will have once you sit down at the computer. Keep it simple, and narrow your focus on the questions you need to answer.
Now you know how Excel can help you to speed up your data analysis. Go have some fun with it!
Make data analysis even easier. Let Visual Integrators get you started. Our goal is to save your business time and make technology work for you.

410.549.9685